
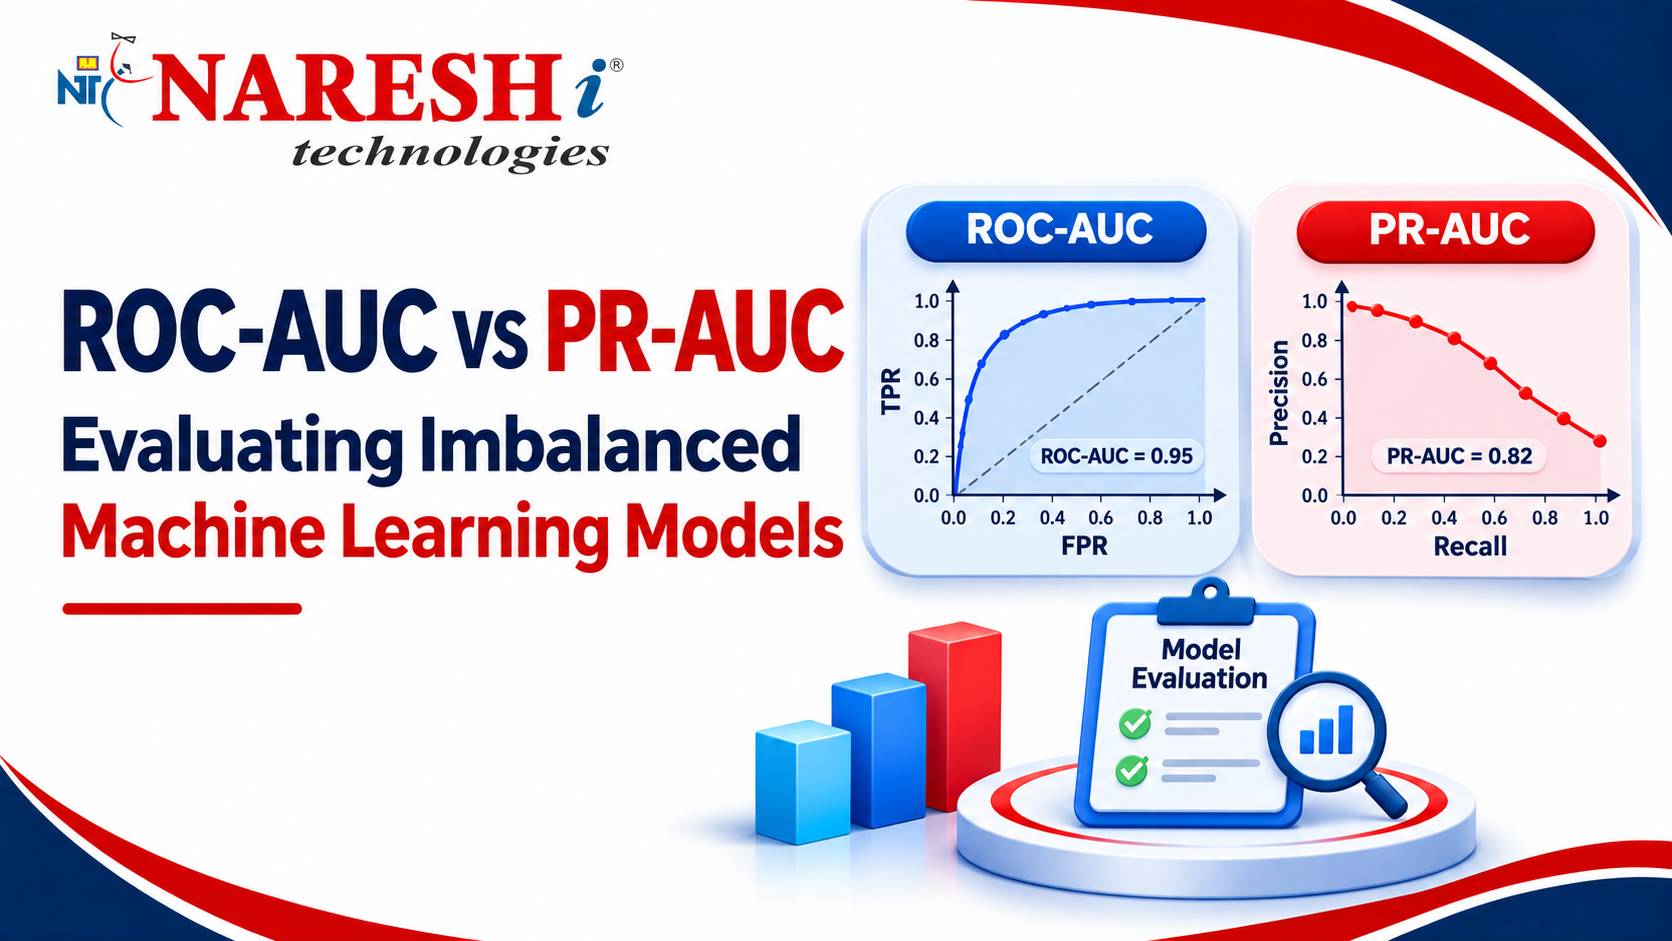
ROC-AUC vs PR-AUC is an important comparison when evaluating binary classification models, especially when one class appears much less frequently than another. Accuracy, precision and recall describe performance at a selected decision threshold. ROC and precision-recall curves examine how a model behaves as that threshold changes.
Quick Answer: ROC-AUC measures how well a model ranks positive observations above negative observations across thresholds. PR-AUC summarizes the precision-recall trade-off and is often more useful when positive cases are rare.
What Are ROC-AUC and PR-AUC in Machine Learning?
Consider a fraud detection system. A model assigns each transaction a probability of being fraudulent. A decision threshold determines whether the transaction is classified as fraud.
Changing that threshold affects the number of false alarms and missed fraud cases.
A Receiver Operating Characteristic (ROC) curve plots the True Positive Rate against the False Positive Rate.
A Precision-Recall (PR) curve plots precision against recall across different thresholds.
These curves help analysts examine model behavior beyond a single accuracy score.
How Does ROC-AUC Work?
ROC-AUC stands for Area Under the Receiver Operating Characteristic Curve.
The ROC curve uses two measures:
- True Positive Rate: TP / (TP + FN)
- False Positive Rate: FP / (FP + TN)
ROC-AUC values typically range from zero to one. A value near one indicates strong ranking discrimination, while approximately 0.5 indicates chance-level ranking in the standard binary classification setting.
However, a high ROC-AUC does not guarantee acceptable precision when the positive class is rare.
What Is PR-AUC?
PR-AUC stands for Area Under the Precision-Recall Curve.
Precision measures the proportion of predicted positives that are correct.
Recall measures the proportion of actual positives that the model identifies.
When positive examples are rare, a small number of false positives can significantly reduce precision.
This makes precision-recall evaluation especially useful in fraud detection, manufacturing defect identification and other rare-event classification problems.
Important: Scikit-learn’s average_precision_score calculates Average Precision (AP). Average Precision and trapezoidal PR-AUC are related but not identical calculations. Always specify which metric you are reporting.
ROC-AUC vs PR-AUC: Key Differences
| Feature | ROC-AUC | PR-AUC / AP |
|---|---|---|
| Curve axes | True Positive Rate vs False Positive Rate | Precision vs Recall |
| Main focus | Overall ranking discrimination | Positive-class detection quality |
| Imbalanced datasets | Can appear strong despite low precision | Often more informative |
| Random ranking baseline | Approximately 0.5 | Related to positive-class prevalence |
| Python function | roc_auc_score() | average_precision_score() |
Python Example: ROC-AUC vs Average Precision
The following example trains a Logistic Regression model using Scikit-learn and evaluates it on a held-out test dataset.
from sklearn.datasets import make_classification
from sklearn.model_selection import train_test_split
from sklearn.pipeline import make_pipeline
from sklearn.preprocessing import StandardScaler
from sklearn.linear_model import LogisticRegression
from sklearn.metrics import roc_auc_score
from sklearn.metrics import average_precision_score

X, y = make_classification(
    n_samples=2000,
    n_features=10,
    weights=[0.95, 0.05],
    random_state=42
)

X_train, X_test, y_train, y_test = train_test_split(
    X, y,
    test_size=0.2,
    stratify=y,
    random_state=42
)

model = make_pipeline(
    StandardScaler(),
    LogisticRegression(max_iter=1000)
)

model.fit(X_train, y_train)

scores = model.predict_proba(X_test)[:, 1]

print("ROC-AUC:", roc_auc_score(y_test, scores))
print("Average Precision:",
      average_precision_score(y_test, scores))
ROC-AUC evaluates ranking discrimination, while Average Precision summarizes precision-recall performance. The results depend on the generated dataset and trained model.
Why Is PR-AUC Useful for Imbalanced Classification?
Imagine a dataset where only 1% of transactions are fraudulent. A model predicting every transaction as legitimate could achieve 99% accuracy while failing to identify any fraud.
ROC-AUC can help assess ranking performance, but a precision-recall curve makes the trade-off between detecting fraud and generating false alarms more visible.
This distinction matters because evaluating rare events requires metrics that reflect the practical consequences of prediction errors.
How to Choose the Right Evaluation Metric
The most appropriate metric depends on the dataset and the cost of errors.
Choose ROC-AUC when overall ranking discrimination across thresholds is the primary concern.
Consider PR-AUC or Average Precision when correctly identifying a rare positive class is particularly important.
Also inspect precision and recall at realistic operating thresholds, along with business costs and model calibration where relevant.
Common Mistakes in ROC-AUC and PR-AUC Evaluation
- Using accuracy alone for imbalanced datasets.
- Confusing ROC-AUC with precision.
- Reporting Average Precision as identical to trapezoidal PR-AUC.
- Evaluating a model using training data only.
- Ignoring the actual class distribution.
- Comparing PR curves across datasets with different prevalence without considering the effect.
Beginner Project: Fraud Detection Model Evaluation
Students can build a small fraud detection experiment using Python.
- Load a suitable binary classification dataset.
- Examine positive and negative class counts.
- Split the dataset using a suitable strategy.
- Train a baseline classifier.
- Generate probability scores.
- Calculate ROC-AUC and Average Precision.
- Plot ROC and precision-recall curves.
- Compare model behavior at practical thresholds.
For structured learning, explore full stack data science with generative ai training in jntu.
Frequently Asked Questions
1. What is ROC-AUC in Machine Learning?
ROC-AUC measures how well a binary classification model ranks positive observations above negative observations across decision thresholds.
2. What is PR-AUC?
PR-AUC summarizes a precision-recall curve, showing the trade-off between positive prediction quality and the ability to detect actual positive cases.
3. Is PR-AUC better for imbalanced datasets?
PR-AUC is often more informative when the positive class is rare, especially when false positives and missed positive cases are important.
4. Is Average Precision the same as PR-AUC?
No. Average Precision uses a weighted average of precision values, while trapezoidal PR-AUC uses numerical area integration.
5. Can ROC-AUC replace Accuracy or F1-Score?
No. These metrics describe different aspects of model performance. Evaluate the metrics that fit the actual prediction objective.
Conclusion
Understanding ROC-AUC vs PR-AUC helps machine learning developers evaluate classification models more responsibly.
ROC-AUC provides information about ranking discrimination, while precision-recall evaluation focuses on identifying positive cases and managing false alarms.
For imbalanced datasets, examining both curves alongside practical operating metrics can lead to more informed model selection.
Discussion Question: For a fraud detection system where only 1% of transactions are fraudulent, which evaluation metric would you prioritize?